Hydrology
Figure 5 is an example of measurements.
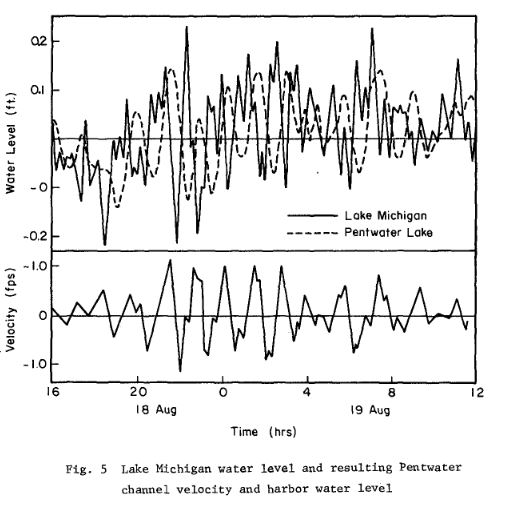
The authors state " Also, velocities high enough to flush sediment from the inlet(say V > 1 fps) occur only about 1 percent of the time so continuous inlet maintenance would likely be required." [p 1658]
August 29, 2015 Several people had an impromptu meeting with Barry. These included Tom Osborn, Chip Gwillim, Bert Jeffries, Jim Lambrix and David Roseman. Barry brought some additional data:
Pentwater Lake data (from Lhttp://www.pentwaterlakeboard.org/):
| Surface area (acres) | 482.4 |
| Average depth (feet) | 24 |
| Max depth (feet) | 50 |
| Contents (acre-feet) | 11,590 |
From Barry:
Pentwater Lake surface area is approx. 483 acres
1 acre = 43,560 square feet
483 acres = 21.04 x 10^6 sq ft
peak flood of 5900 cfs (500 yr frequency)
With no outflow, would take 59.4 minutes to raise lake 1 ft. (Peak seldom lasts 1 hr on small rivers)
The ongoing question is whether the conditions would ever mobile sand from the channel. This information raises considerable doubt.
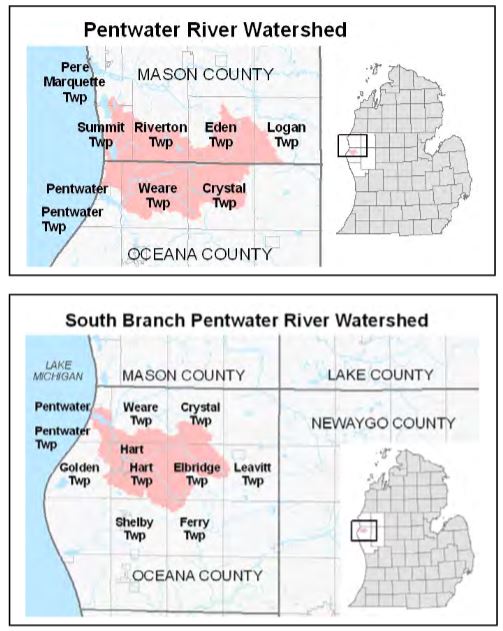
Watershed information [1]
"WMSRDC Watershed Partners Inventory – 2008
– HUC Code: 04060101
Size and Location:
The South Branch of the Pentwater River Watershed is approximately 57,014 acres (89.3 square miles) and covers a portion of nine townships in Oceana County. The South Branch contains 127 miles of rivers,streams, and drains and runs directly through the City of Hart and the Village of Pentwater before emptying into Pentwater Lake. Land uses are 48% agricultural, 31% forest land, 14% open land, 4% urban, 2% wetlands, and 2% water. Land uses are threatened by excessive sediment, nutrients, and fecal coliform, and agricultural chemicals from agricultural and residential sources. This project installed practices to protect surface water, including grade stabilization structures and vegetation establishment practices, as well as practices to protect groundwater, such as agrichemical containment facilities, fuel storage, waste utilization, and cover crops."
Peak Flow Analysis of Michigan USGS Gages [2]
04122230	North Branch Pentwater River near Pentwater, MI
Number of peaks in record: 30
Number of peaks in analysis: 30

Annual	Qp Estimate	95 Percent	95 Percent
Exceedance	per	Confidence,	Confidence,
Probability	Bulletin 17B	Lower	Upper
0.9950 (1.005 years)	79.9	55.2	102.9
0.9900 (1.01 years)	89.2	63.3	113.0
0.9500 (1.05 years)	121.4	92.6	147.5
0.9000 (1.11 years)	143.6	113.4	171.0
0.8000 (1.25 years)	176.4	144.9	206.3
0.5000 (2 years)	264.2	227.3	306.8
0.2000 (5 years)	400.8	342.8	487.6
0.1000 (10 years	500.9	419.9	635.5
0.0400 (25 years)	637.9	519.4	853.2
0.0200 (50 years)	747.3	595.5	1038.0
0.0100 (100 years)	863.0	673.4	1241.0
0.0050 (200 years)	985.7	753.9	1465.0
0.0020 (500 years)	1160.0	864.9	1796.0
0.6667 (1.50 years)	214.6
0.4292 (2.33 years)	288.1